The Banana Index Revisited
 created by DALL·E
Recently, the Economist proposed the banana index as a way to compare the relative environmental impact of different foods.
The banana index gives the greenhouse-gas emissions of foods by their equivalent in bananas! The banana was chosen as baseline due to its “middling climate impact and nutritional value”. Benchmarking emissions to a single food (the banana in this case) gives a sense of how different foods rank.
However, the banana index only relies on emissions for a given food and “does not capture other environmental impacts, such as land use”. Here, I revisit the data looking at land use in parallel to emissions.
Why is this relevant? Imagine two foods with the same greenhouse-gas emissions, but different land use scores. Based solely on emissions we should be indifferent between them. But, based on both emissions and land use we should be prefer the one with the lowest land use.
The calculations
As mentioned, the index gives the emissions of foods by their equivalent in bananas. This is simply a ratio of emissions efficiency.
For example, producing one kilogram of beef burger results in as many emissions as 61kg of bananas (this is a banana index of 61). This measures emissions by weight (i.e. emissions per kg), but we can do the same for nutritional value (calories and protein content). For instance, producing 1 calorie of beef burger causes 25 times as much emissions as 1 calorie of banana (i.e. banana index of 25). As for protein, the score is 4. We get similar results, for other beef-derived foods. The bottom line: “beef is bad for the environment no matter how you slice it”, and how you measure it!
To be more explicit about the calculations, the production of 1 kg of a beef burger brings about 54 kilograms of CO2-equivalents. Bananas bring about 0.88 kilograms of CO2-equivalents. A burger’s banana index, by weight, is therefore equal to 54/0.88, which is 61.
Here, I use the same methodology to calculate the banana index for land use. This is the land use of foods by their equivalent in bananas - a ratio of land use efficiency. I use the same data source as the original article.
A banana index for land use
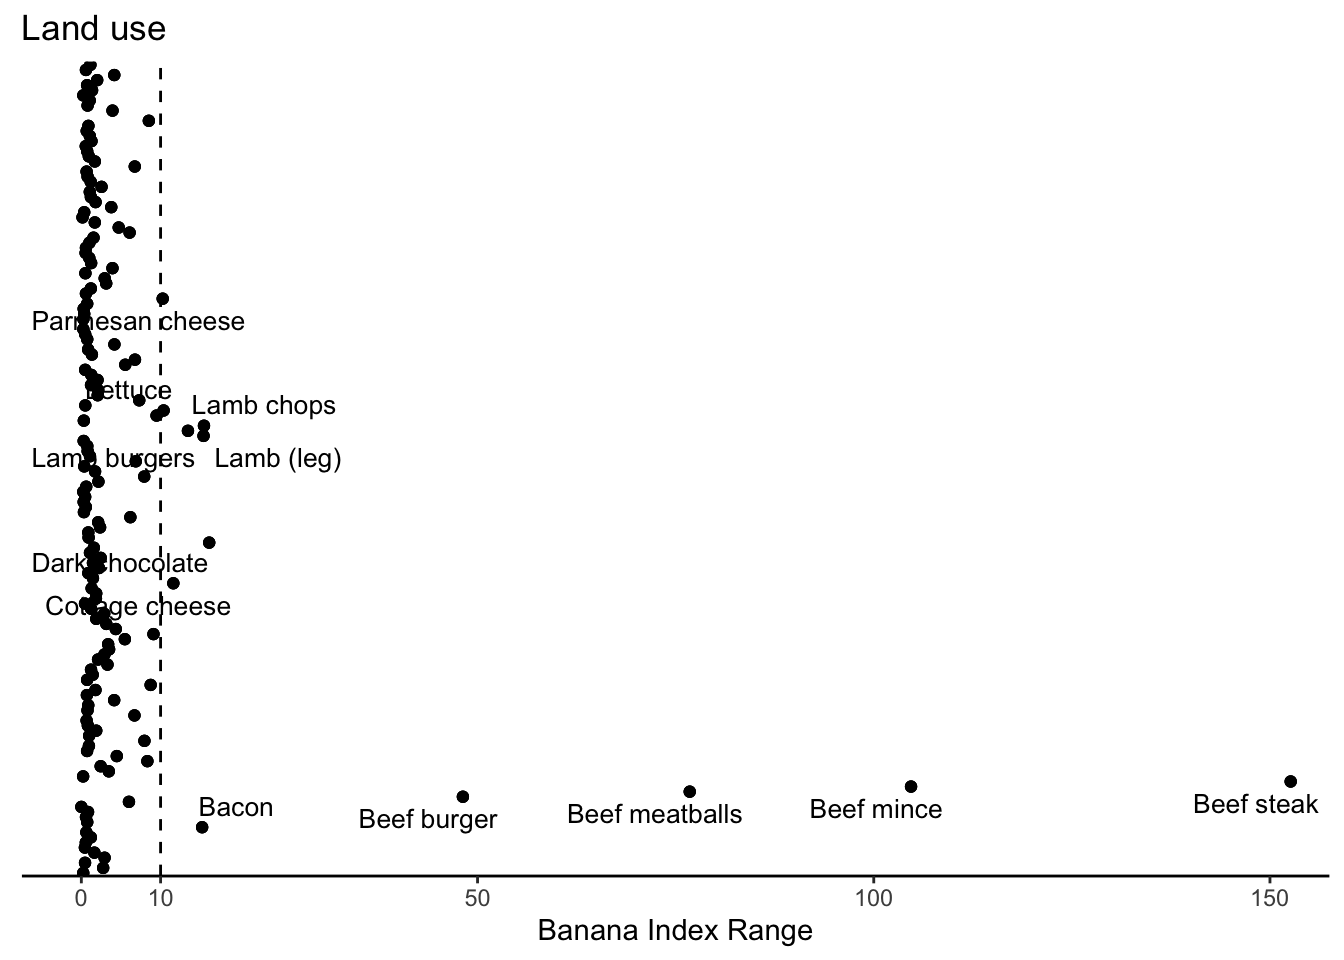
The index for 160 foods is plotted below. To improve visualisation is it on the natural logarithmic scale. This mean that 0 (vertical line) corresponds to a banana index of 1, the land needed to produce one kilo of bananas.
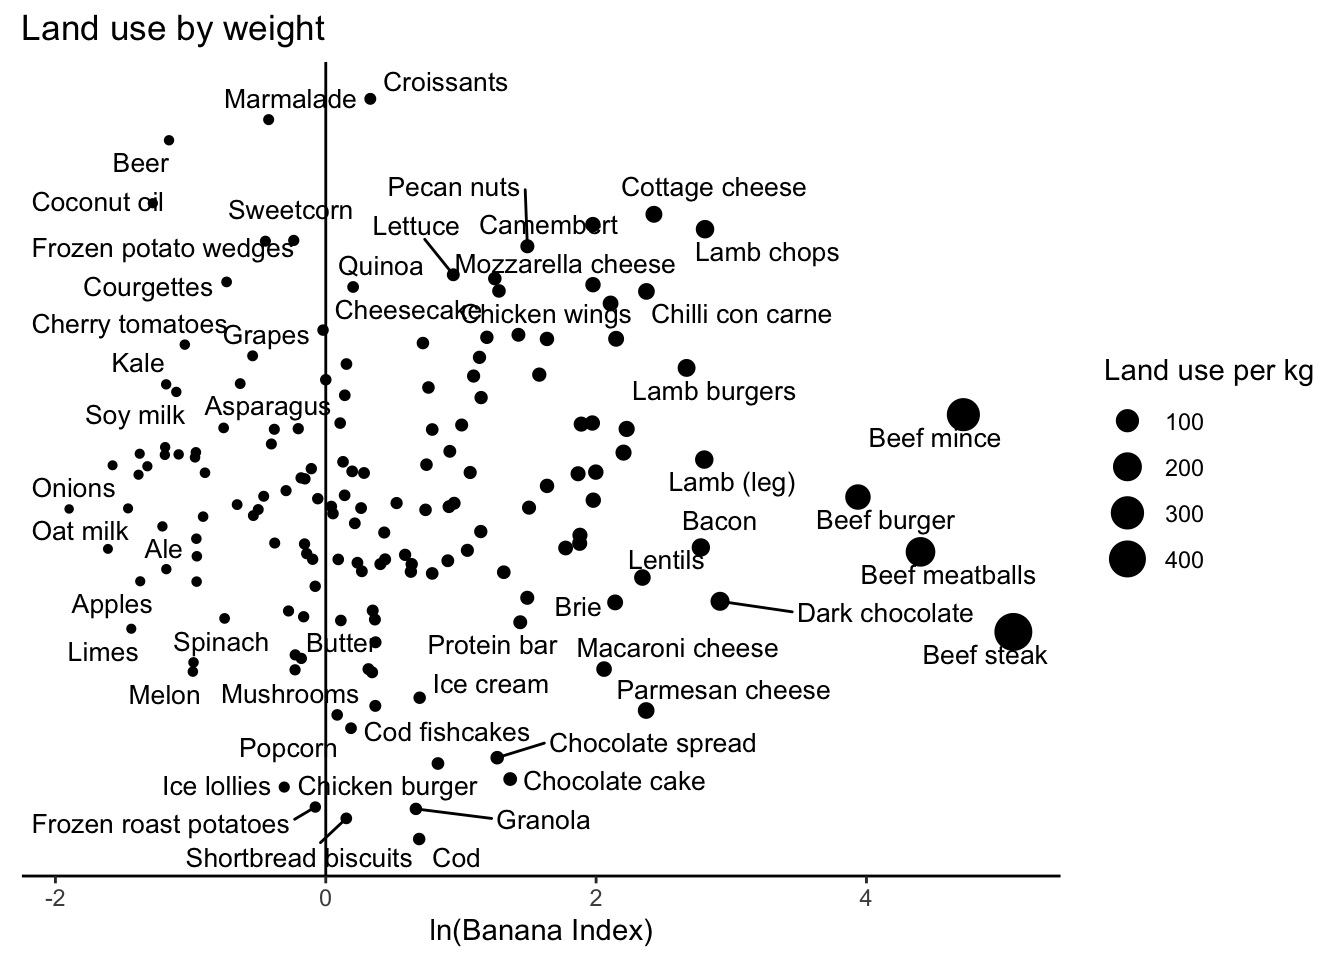
Beef is not bad only in terms of emissions (as shown above) but also in terms of land use (by weight), with an index between 51 and 161, depending on the slice:
## entity BI_land_use_kg
## 1 Beef steak 161.87864
## 2 Beef mince 111.84592
## 3 Beef meatballs 81.44308
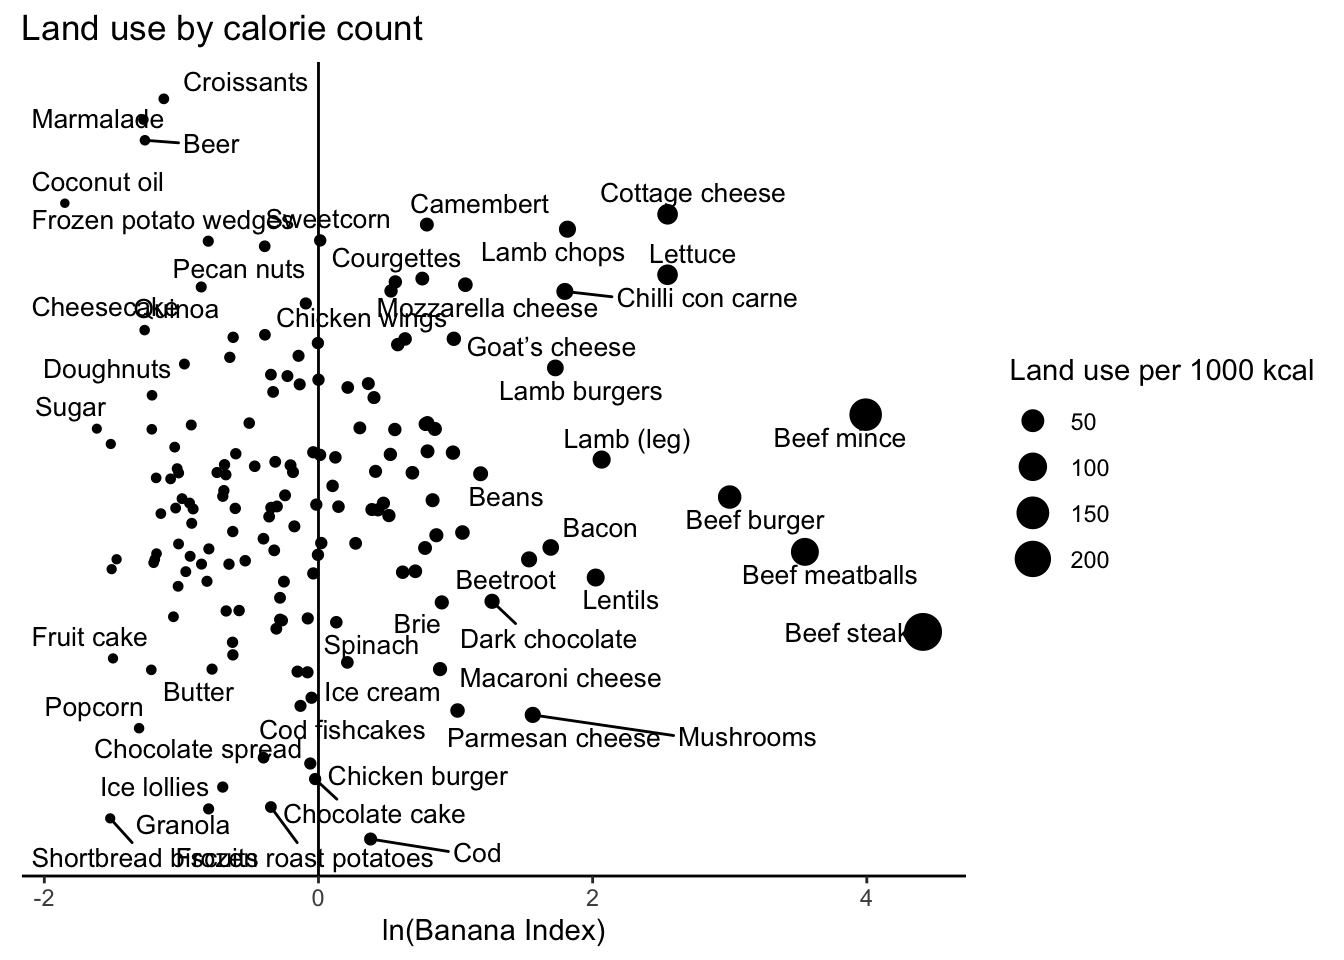
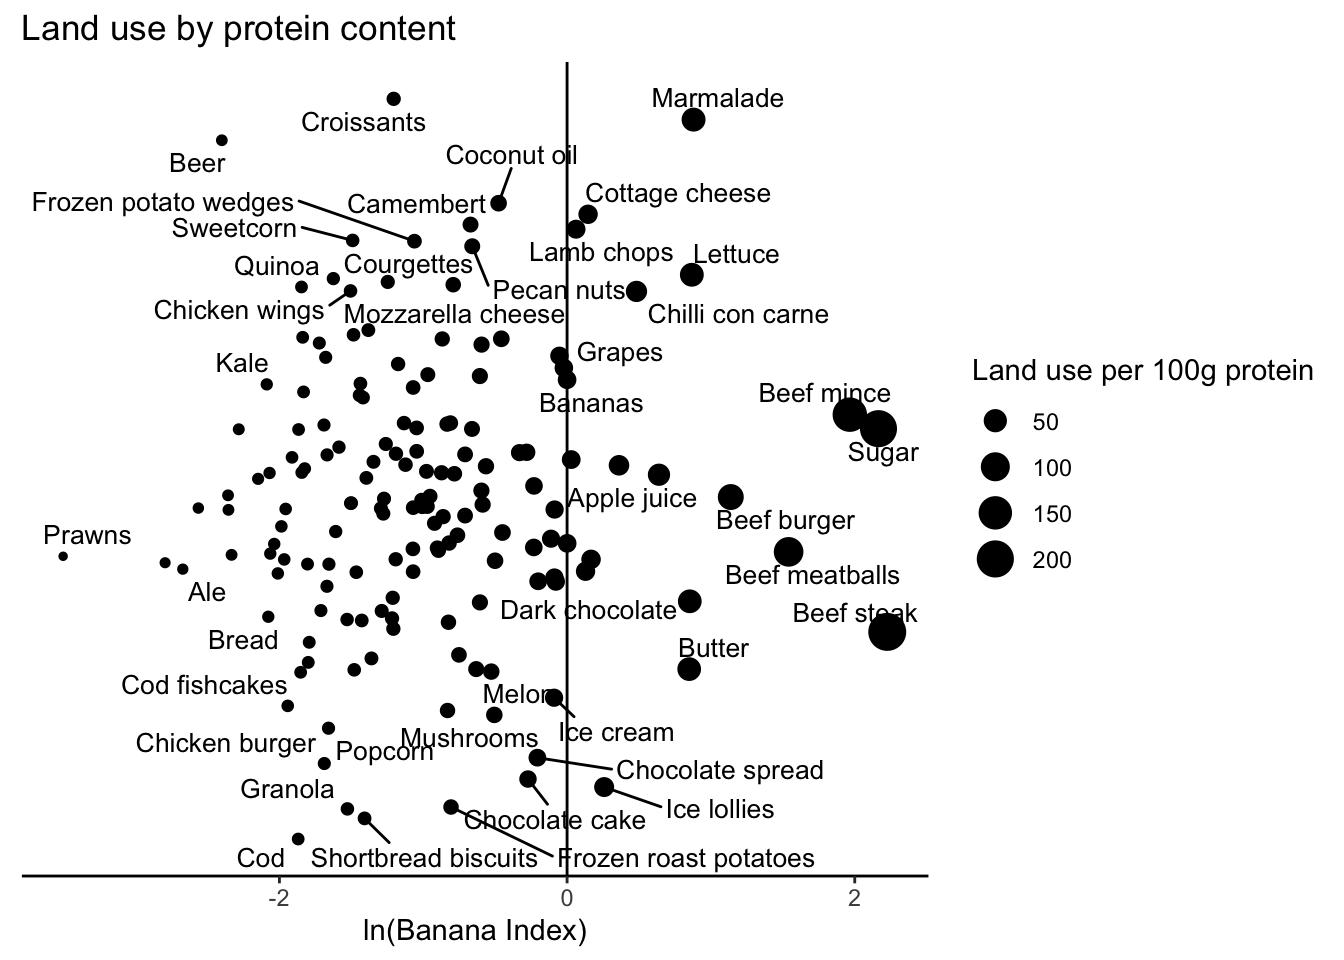
## 4 Beef burger 51.27127The results are similar if we calculate the index for nutritional value (calories and protein content):
In terms of protein content Sugar has a large index (8.72)! This means 1g of sugar protein requires 8.7 times as much land as 1g of banana protein. This is probably because sugar has extremely low values of protein content to begin with.
Variability in the banana index
Looking at emissions, some foods out-emit bananas on one metric put them to shame on another. To illustrate this, for each food I calculate the range in its banana index between the three metrics - weight, calories and protein content. This allows to capture the variability in emissions between the three metrics. The vertical dashed line corresponds to a range of 10. That is a difference of 10 between the minimum and maximum banana index. A substantial number of foods exceed this value, showcasing that how we calculate the index actually matters.
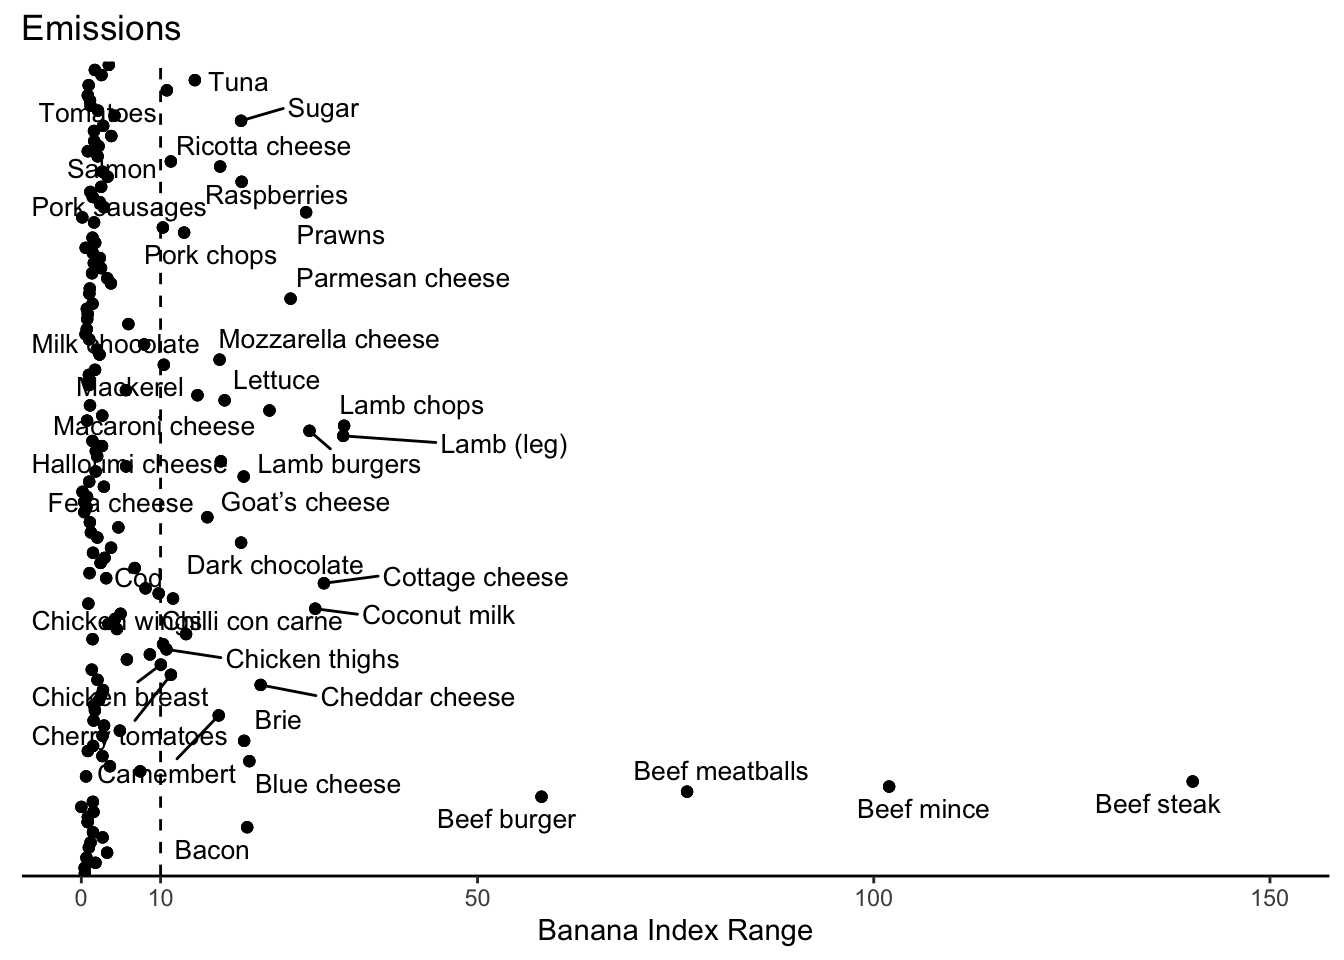
Again, beef is the most variable. For example, a beef steak has a banana index of 148.6 when emissions are measured by weight, but only 8.3 when measured by protein content.
##   BI_emissions_kg BI_emissions_calories BI_emissions_protein
## 1        148.5633              77.75263             8.312805
Following the same approach for land use, we still find beef to be the most variable, but most foods show decreased variability in their banana index - they cluster closer to 0. This indicates the land required to produce these foods, by weight or nutritional content, does not change a lot. This is interesting, since in contrast to emissions (as we just saw) how we calculate the index for land use does not seem to matter that much.
Emissions and land use
Lastly, I look at the relationship between emissions and land use. The banana index for land use (y axis) is plotted against the index for emissions (x axis). This is done by weight (top-left), calories (top-right) and protein content (bottom). Foods falling into the diagonal dashed line have the same banana index for both emissions and land use. The blue lines correspond to the “average” relationship across all the foods.
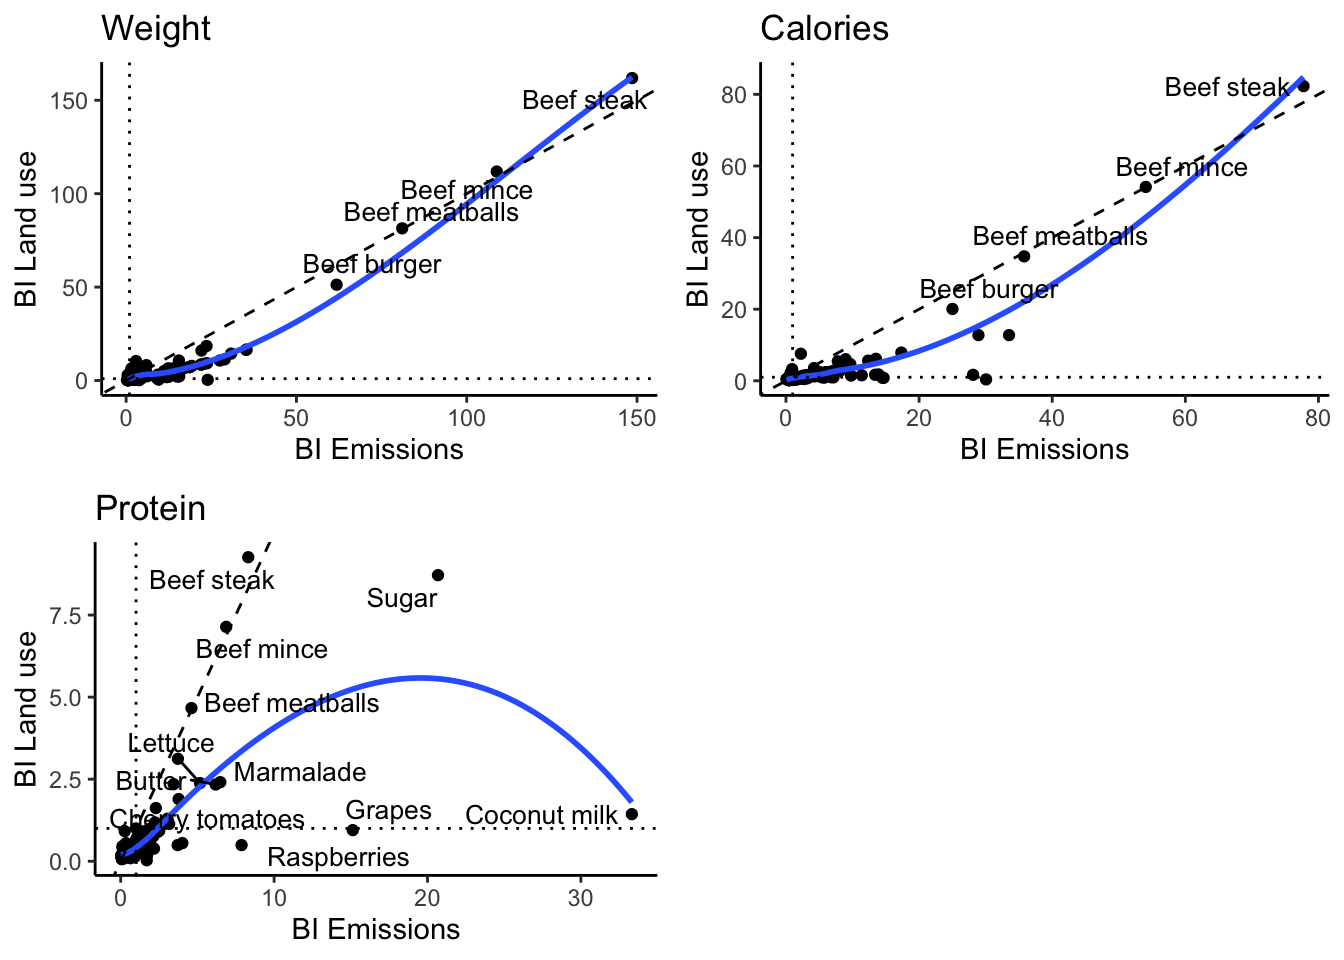
In terms of weight (top-left) most foods have higher index for emissions than land use. One example is salmon: producing 1 kg of salmon out-emits bananas by a factor of 12, but requires only 1.8 times more land.
Additionally, we find foods that out-emit bananas but require less land, or the other way around. For example, producing one kg of raspberries results in as many emissions as 9.6 kg of bananas, but requires only 0.6 the space. On the other hand, almond butter and almonds emit less than bananas (per kg produced), but require about 3 times the land. In fact, these two are the only examples of such relationship.
##   entity BI_emissions_kg BI_land_use_kg
## 1 Salmon        11.92258       1.798589
## entity BI_emissions_kg BI_land_use_kg
## 1 Raspberries 9.584904 0.5852042## entity BI_emissions_kg BI_land_use_kg
## 1 Almond butter 0.4431345 2.910438
## 2 Almonds 0.6897214 3.117983Similar trends are seen when looking at calories (top-right). Instead, in terms of protein content we see a few outliers. Most notably, sugar, coconut milk, and grapes. All of them result in high emissions per 100g of protein, but do not have proportionaly large space requirements.
##         entity BI_emissions_protein BI_land_use_protein
## 1 Coconut milk             33.32015           1.4345743
## 2       Grapes             15.12852           0.9482029
## 3        Sugar             20.68580           8.7152656
The plots above allow to find the worst food in terms of emissions and land use. These occupy the top-right corner on the plots. Beef is by far the worst food for the climate!
This implies that if we shifted to a plant-based diet not only we would considerably reduce emissions but also reduce global land use. In fact, it has been estimated this shift would reduce the global agricultural land use from 4 to 1 billion hectares.
Conclusions
We’ve seen substantial variability in the environmental impact of different foods. Common assessments typically rank foods by their emissions of greenhouse gases. Nevertheless, the utilization of land is equally crucial. In fact, the expansion of agricultural land is the leading driver of deforestation and biodiversity loss. Both matter!